Tuesday, July 7, 2015

Oil and doomsday

Recently, I provided an estimate of the amount of oil that was formed in the Earth—about 18 trillion barrels.  It's always good to tackle these kinds of problems from different angles, and before using the composition of the atmosphere to do the calculation, I had planned to re-purpose the doomsday argument.  It seems much better suited to this type of problem.  After all, there is a finite amount of oil—or, rather, a finite number of barrels of oil—that we are drawing from.

However, before we are able to apply the doomsday argument, we need to know how many barrels of oil have already been consumed. Using data from Energy Trends Insider, it appears that approximately 1.4 trillion barrels have been produced in modern history.  That being said, reliable verifications of this estimate are hard to find.


Using the doomsday argument, we find that we can be 94% confident that there are at most 16.6 trillion barrels of oil remaining, given that we have already consumed 1.4 trillion barrels.

Tuesday, June 30, 2015

Weapons of Reason: The paradox of skill

"The race is not to the swift or the battle to the strong, nor does food come to the wise or wealth to the brilliant or favor to the learned; but time and chance happen to them all." ― Ecclesiastes 9:11

Stephen Jay Gould is known not only for his work in biology, but also for a collection of essays on baseball.  In "Why No One Hits .400 Anymore," he explains just that, with a fairly elegant solution.  The pool of talent in baseball has grown since the early days, strategies and tactics have been improved, and players receive better training.  Another way of putting this is that the average skill among players has improved.  However, as they have improved, they are also beginning to approach the natural limits of what the human body is capable of.  When the entire community of players approach this limit, the community looses variation—there is now less room to spread out.
2009 Belmont Stakes photo finish.
This observation is sometimes called the paradox of skill—the greater the average skill level in a community, the less important skill becomes in determining the outcome of competition.  In the above photo finish, the difference between the two horses is only a few inches.  Both the horses were bread and trained to run competitively; however, the outcome was likely determined by essentially random factors that gave one horse a slight edge over the other.  This effect can be seen at work elsewhere.  At one time, higher education would have ensured employment in highly desirable, relatively low stress jobs.  Now, college education is becoming necessary for gainful employment at all.

Thursday, June 25, 2015

Population density

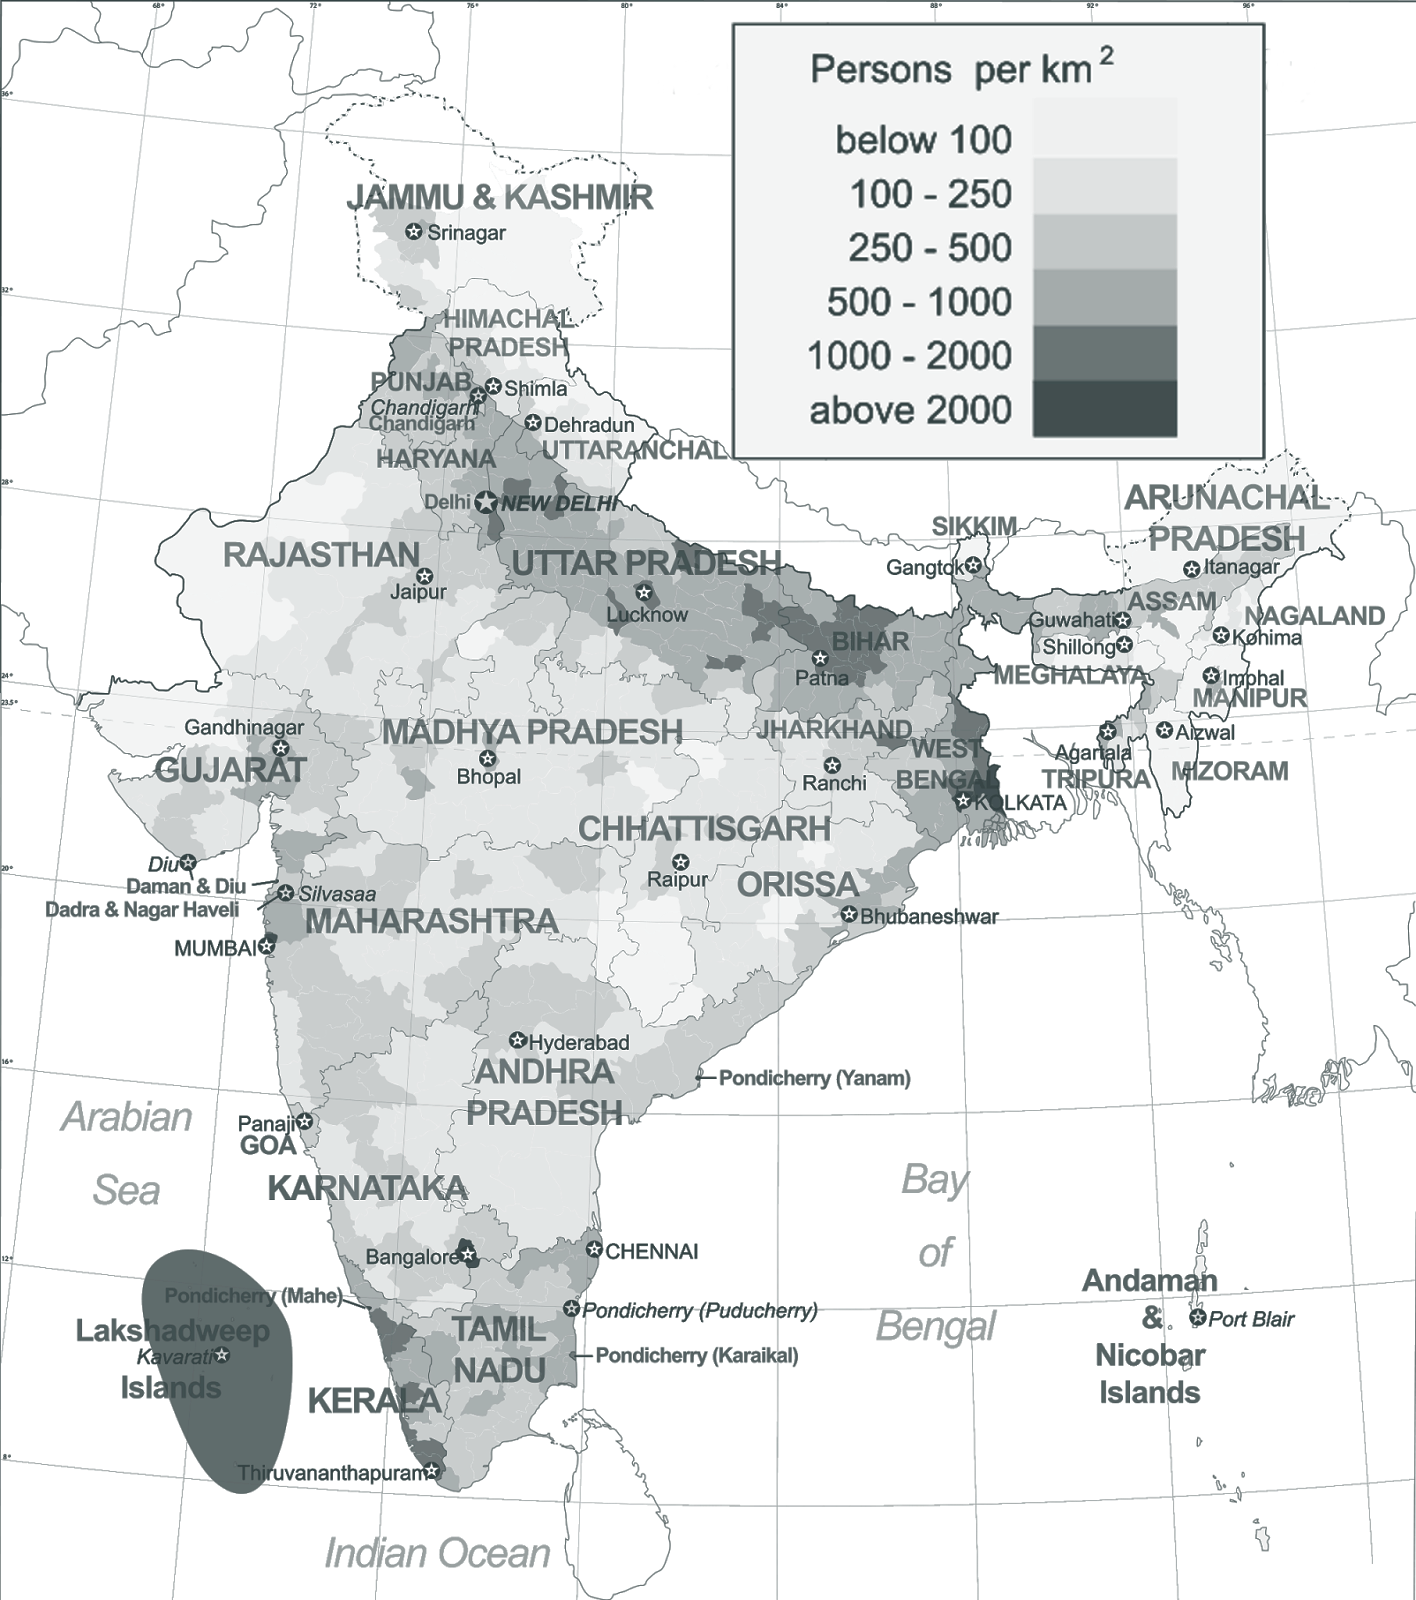
What would the population of the United States be, if it were as densely populated as India?  I was under the impression that India's population density is only slightly greater than that of the U.S.  This assumption is wrong.
The answer to the question is 4 billion people.  When will this happen?  The quick way to answer this question is to consider historical growth rates.  During the 20th century, the U.S. averaged 1.3% population growth per year.  At this rate, population would reach 4 billion by the year 2210. A lot can happen in 200 years to affect the actual growth rate.  That being said, the U.S. may reach a population of 1 billion—the equivalent of the population density of Europe—by the year 2100 at a 1.3% growth rate.

Wednesday, June 24, 2015

Peak oil, part II

"It is sunlight in modified form which turns all the windmills and water wheels and the machinery which they drive. It is the energy derived from coal and petroleum (fossil sunlight) which propels our steam and gas engines, our locomotives and automobiles." ― John Harvey Kellogg
In a previous post, I wrote about peak oil—particularly that answering the question of how much oil is left is not easy.  That said, a new approach has occurred to me.  Oil and coal are the remains of ancient plants, formed 300 million years ago in the carboniferous period—C on the horizontal axis of the chart below.  The periods leading up to this saw the proliferation of plants, which removed massive amounts of carbon from the atmosphere.  At its peak, carbon dioxide made up 7000 parts per million (ppm) of the atmosphere, but today makes up only 180 ppm.  This carbon went somewhere, and for the most part it was sequestered in rocks as coal and oil.  A simple calculation puts the weight of this carbon to be 10 trillion tonnes.
How much is oil and how much is coal?  Consider the proven reserves of oil versus coal.  There are 190 billion tonnes of oil reserves, but there are 860 billion tonnes of coal reserves.  Assuming that this reflects their natural abundance, we'll assume that oil and coal are in a ratio of 5 to 1 of sequestered carbon.  This implies that there have been 3.6 trillion tonnes of oil and natural gas—18 trillion barrels—and 11 trillion tonnes of coal.

How long will this last?  As of 2015, 93 million barrels of oil are consumed per day—about 34 billion per year—which has grown by about 1% per year since the 1980s.  If this continues, there are 185 years of oil.  That being said, consumption must eventually stop growing and begin to decline—that is the notion of peak oil.  Instead, oil rations will eventually be put into effect, which could mean that oil will be here for centuries.  As for coal, 7.5 billion tonnes are consumed per year, growing by about 2% per year since the 1980s.  This implies a 170 year supply.  The same caveats apply.  Many things can change in this time, too.  It's still hard to say how long we will burn fossil fuels.

Tuesday, June 23, 2015

Guaranteed minimum income

"I care not how affluent some may be, provided that none be miserable in consequence of it." ― Thomas Paine, Agrarian Justice
The concept of guaranteed minimum income—GMI—is relatively self-explanatory.  The government would send periodic payments to households to guarantee a minimum income.  Let's suppose that a program was implemented in which, on average, every person received 6,800 dollars per person per year—this is approximately 100% of the poverty threshold—costing a total of 2.2 trillion dollars.  This program would be difficult to fund.  The government collected 3 trillion dollars in taxes in 2014, but that would probably change when the GMI program is implemented.

There are about 150 million jobs in the United States, which means each job provides, on average, 20,000 dollars in tax revenue.  However, GMI could render minimum wage obsolete.  A large number of jobs would open up, mostly unskilled positions paying a few dollars per hour.  How many is hard to say.  For the sake of argument, let's say a 70% decrease in minimum wage, would lead to a 10% increase in the number of jobs.  The net result would likely be a 66% decrease in taxable wages, if the GMI is not taxed.  Though dubious, my calculations suggest this would cause a 14% decrease in tax revenue.  That is, 2.5 trillion dollars, which would just about cover the costs of the program.

That's not to say that a similar program cannot be implemented.  Giving GMI payments to the bottom 20% of the population would cost less than half a trillion dollars annually—on par with current welfare spending.  Furthermore, solutions such as universal basic income have gained support from both left- and right-wing politicians.

Wednesday, June 17, 2015

Endangered element: indium


Unlike others in the endangered element series, indium use is not dominated by a single application—indium is employed in a number of applications.  For example, the screen you are looking at contains indium in the form of ITO—indium tin oxide—whose semi-conductive properties make it useful for controlling liquid-crystals.  Indium semi-conductors are also useful for thin-film solar panels, LEDs, and electroluminescent materials.  It is also found in solder, sodium vapor lamps, and nuclear control rods.  Truly, it's a versatile metal.

However, indium is relatively rare.  It comprises only 50 parts per billion (ppb) of the Earth's crust. One author compares indium with silver, claiming that silver is less abundant yet produced in higher quantities.  However, silver comprises 70 ppb of the Earth's crust—still quite rare, but about as common as indium.  Furthermore, silver is commonly found in ores, such as argentite.  Indium minerals are uncommon.  Instead, it is extracted from sphalerite—zinc ore—where it has a concentration of 1 to 100 parts per million.  Fortunately, there has been substantial interest in finding substitutes for indium.  Many of these solutions, however, still rely on non-renewable resources, like petrol chemicals or other endangered elements—e.g. gallium arsenide.

Tuesday, June 16, 2015

Cost of electricity

"Why, sir, there is every probability that you will soon be able to tax it." — Michael Faraday on the practical value of electricity
We are living in a period of extraordinarily cheap energy—but exactly how much does energy cost?  Fortunately, Open Energy Information—OpenEI—collected data on the costs for different forms of electricity production.  The problem is that different technologies incur different costs.  A coal plant requires a turbine to be built and maintained, but also require fuel.  Solar panels simply need to be constructed, but then collect energy from the sun without additional fuel inputs.  To take these differences into, we'll use a metric called the levelized cost of electricity—LCOE.  The LCOE is the present value of all the costs involved in operating the electrical plant.

Using the OpenEI data and U.S. energy data, we can compare the relative costs of the energy produced in 2011, for example.
Source LCOE
(USD/MWh)
%
Production
Cost
(b USD)
Hydropower 20 8.0 18.5
Coal,
unscrubbed
40 15.3 70.3
Coal,
scrubbed
50 30.6 175.9
Natural gas 50 19.7 113.4
Geothermal 60 0.4 2.9
Nuclear 60 21.1 145.3
Wind 60 3.0 20.6
Solar,
Photo-voltaic
200 0.4 12.3
Solar,
thermal
280 0.02 0.5
What inferences can be drawn from this?  First, we are likely to use primarily coal  and natural gas power for a long time—they are among the cheapest on the list.  However, because they are so low, they are more likely to increase than to decrease.  This could be driven by increasing fuel prices, but this is likely decades away.  Solar power—particularly, photo-voltaic solar power—could still decrease substantially in cost per megawatt-hour.  It is much easier to go from 200 dollars per MWh to 100 dollars per MWh than it is to go from 20 dollars per MWh to 10 dollars per MWh.  The technology to make cheap solar energy available may soon be widely available.